
The problem
Most lost business never shows up as a lost deal.
A customer who ordered every two weeks just stops. Another moves half their spend somewhere else. A part they reorder like clockwork is a month late. Nobody cancels, nothing triggers an alert, and by the time someone notices, the account is gone.
You have the data. We have the insights.
Regular buyers who stopped ordering.
Still ordering, but well below last year.
Parts a customer buys on a steady cycle, now past due.
And the accounts that are growing, so you can protect and expand them.
How it works
One export to start. Proactive every month after.
Send your order history
Export three years of invoices from your system, as Excel or CSV, just as it comes out. Drop it in a private shared folder. No reformatting, no new software.
Get your report
Clear, actionable insights on where your business is leaking revenue: who's gone quiet, who's buying less, which reorders are overdue, and what each one is worth.
Stay ahead every month
Send each new month. Your monthly report flags new risks early, while there's still time to act, and shows which customers came back. Every quarter, a full review.
What you get
Every account, checked. The ones that matter, ranked.
The interactive report
Opens in any browser. Filter by what we found or by sales rep, search for a customer or part, and hover any chart to see the numbers.
Every account, part by part
Click any account to see what they buy, when they last ordered each part, how often they usually do, and 24 months of their sales.
A first step for each
Every flagged account comes with what we saw and a suggested next move, ranked by the profit at risk.
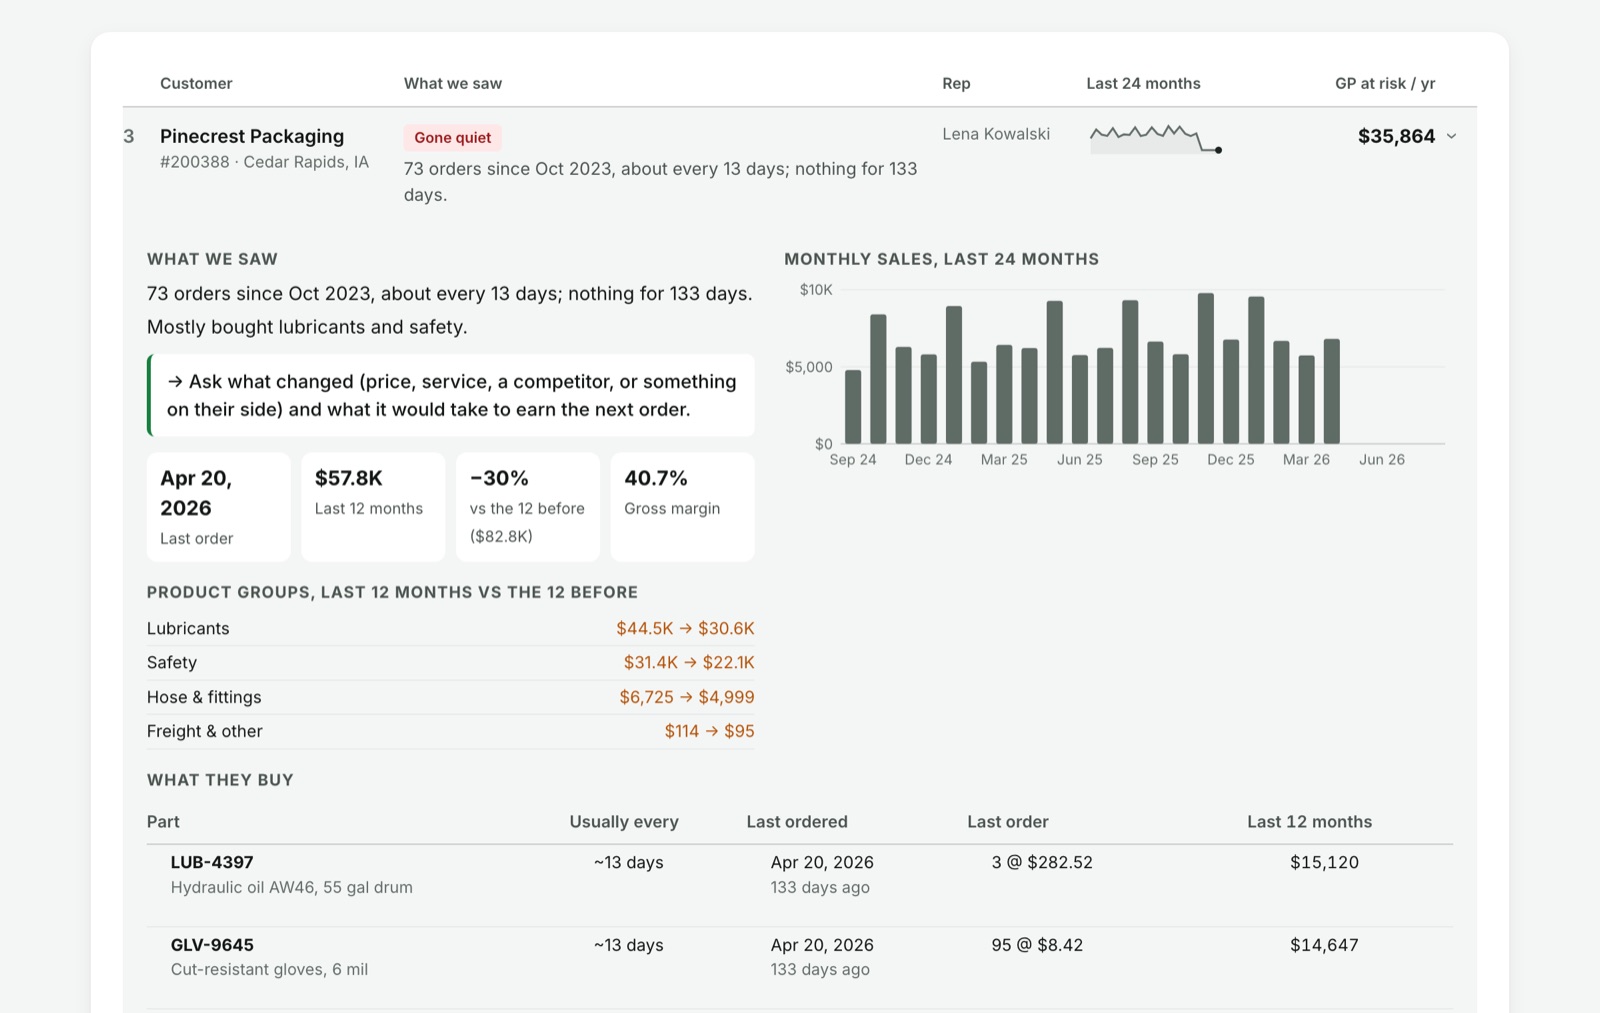
Values are in gross profit when your export includes costs, so you see margin, not just sales. "At risk per year" assumes the lost business stays lost at its current pace: an upper bound, not a forecast.
Every month
Preventive maintenance for your revenue.
Your first report finds the revenue that's already slipping. Monthly reports keep it from happening again: with current data every month, we flag the customers who are starting to drift while there's still time to win them back.
New risks, caught early
A late reorder gets flagged while it's still a late reorder, not a lost account.
Proof it's working
See which flagged customers ordered again, and what they've bought since.
A full review every quarter
The three-year picture again, plus everything that changed since your last report.
Who it's for
Distributors and manufacturers with repeat customers.
Companies whose customers reorder the same parts and supplies, with more accounts than anyone can watch one by one.
If your system can export invoice lines, we can work with it.
- Date
- When it was invoiced
- Invoice
- The invoice or order number
- Customer
- Number or name
- Part
- Part number, and a description if you have it
- Quantity and amount
- How many, and the line total
- Cost helpful
- So the report can show gross profit
- Sales rep helpful
- So each rep gets their own list
Your data
Your sales history stays yours.
An NDA comes first
We sign a confidentiality agreement before you send anything.
Used for your reports only
Your sales history is used only to build your reports. It's never sold, never shared, and never used for anyone else.
Every number traces back
Each flag shows the numbers behind it, and every report explains how the flags are found.

About
Built by someone who sells industrial products for a living.
I've spent my career in industrial sales. As a regional sales manager covering several states, I grew my territory to over $5 million, and I kept running into the same problem. The answers I needed (who had stopped ordering, who was buying less, which reorders were late) were buried in my customers' sales history. Digging them out by hand took hours, and I was spending more time in spreadsheets than actually selling.
So I built a tool to do the digging for me. If it helped me, I figured it could help other sales teams too. That's BacklogBoost: every account checked, every month, so the ones slipping away get a call while there's still time.
I also hold 12 certificates in artificial intelligence. The technology behind BacklogBoost is built with care, not guesswork.
Justin Levine, founder
Questions
Common questions
What do I need to send?
One export of invoice lines: date, invoice, customer, part, quantity and amount for each line. Costs and sales reps help. Three years of history for the first report, then each new month.
Do I need to install anything?
No. You export a file your system already produces, and you get your report back. No logins, no integrations.
My export looks different from other companies'. Is that a problem?
Usually not. We match your columns automatically and check every row before using it. If something doesn't fit, we ask instead of guessing.
How is this different from my ERP's reports?
Your ERP reports what happened. This looks for what's missing (the regular customer who hasn't ordered, the overdue part, the shrinking account) and puts them in one ranked list with a first step.
Does it use AI?
Yes. BacklogBoost is built with modern AI tools, by someone who holds 12 AI certificates. The findings themselves come from clear rules applied to your own sales history, so every number can be checked against your invoices. If you've been looking for a practical way to put AI to work in your business, this is a good place to start.
What does it cost?
Please schedule a call to discuss pricing.
Can I see a sample first?
Yes. Open the sample report, built for a fictional distributor. Click any account to see the detail.